WAIT ANALYSIS
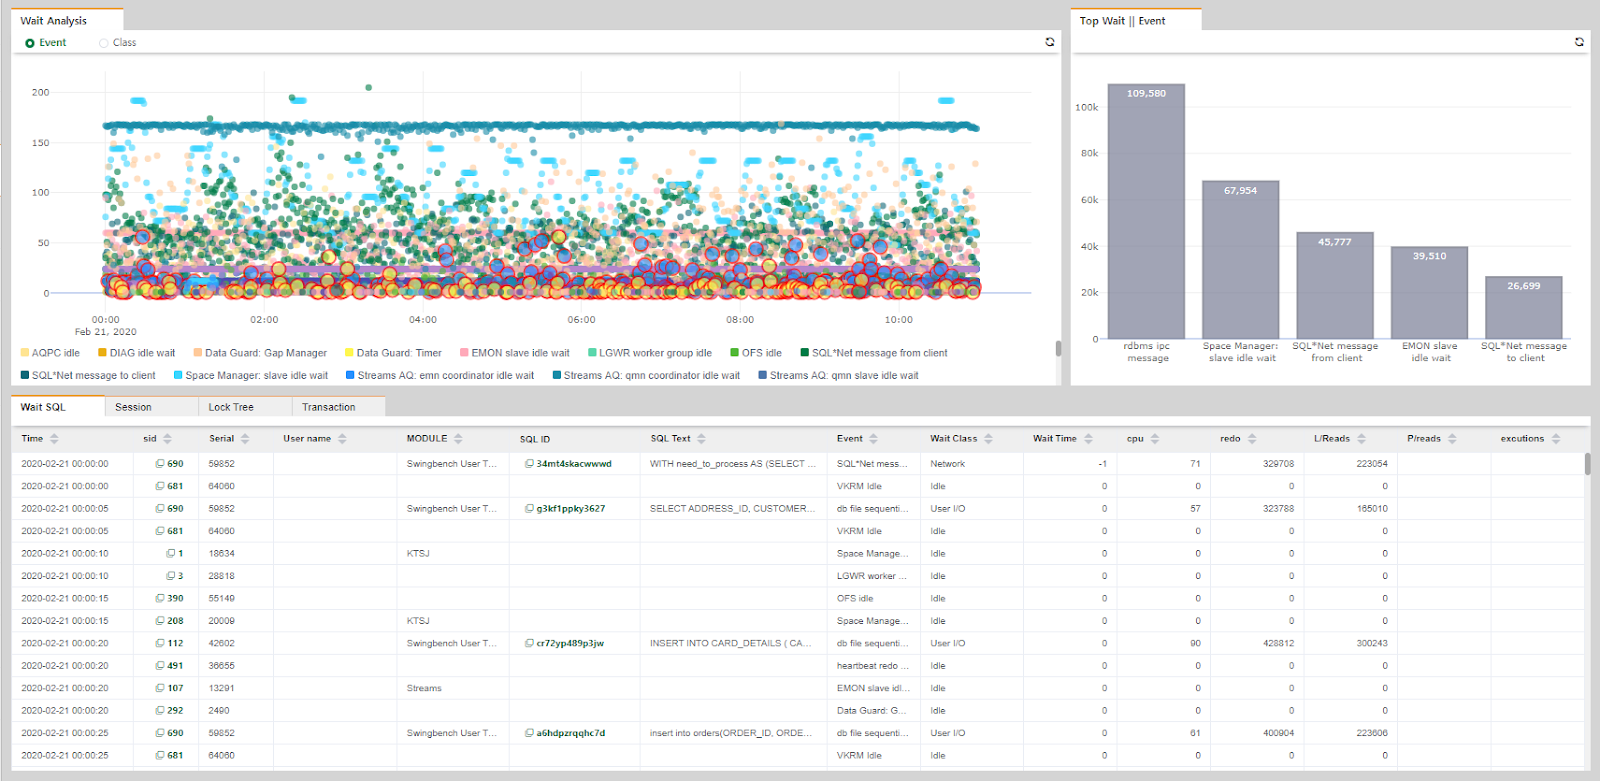
Wait Analysis provides the following performance data:
- Wait Chart : You can check the data by time zone by event or class. When an Enqueue event occurs, the outline is displayed as a large-sized bubble that is highlighted, which is easy to see.
- Top Wait : Graph of the top high wait elements by event or class. Shows the grid at the bottom filtered by the event or class selected when you click the graph.
- Wait SQL : Shows a list of sessions from Wait information in the top Wait Analysis chart.
- Session : Displays a list of all session information in the time zone of the Wait Analysis chart
- Lock Tree : Displays all lock information that occurred during the Wait Analysis chart time zone.
- Transaction : Lists large uncommitted transaction information for the Wait Analysis chart time zone.
- NORMAL: Transactions that have not been committed for more than a certain period of time (approximately 5 minutes) since the Insert.
- ROLLBACK: Rollback lasts for a period of time (approximately 5 minutes) after the UPDATE, DELETE, and so on.