EVENT ANALYSIS
Event Analysis offers two features:
- User-specified threshold alarm
- Oracle Alertlog
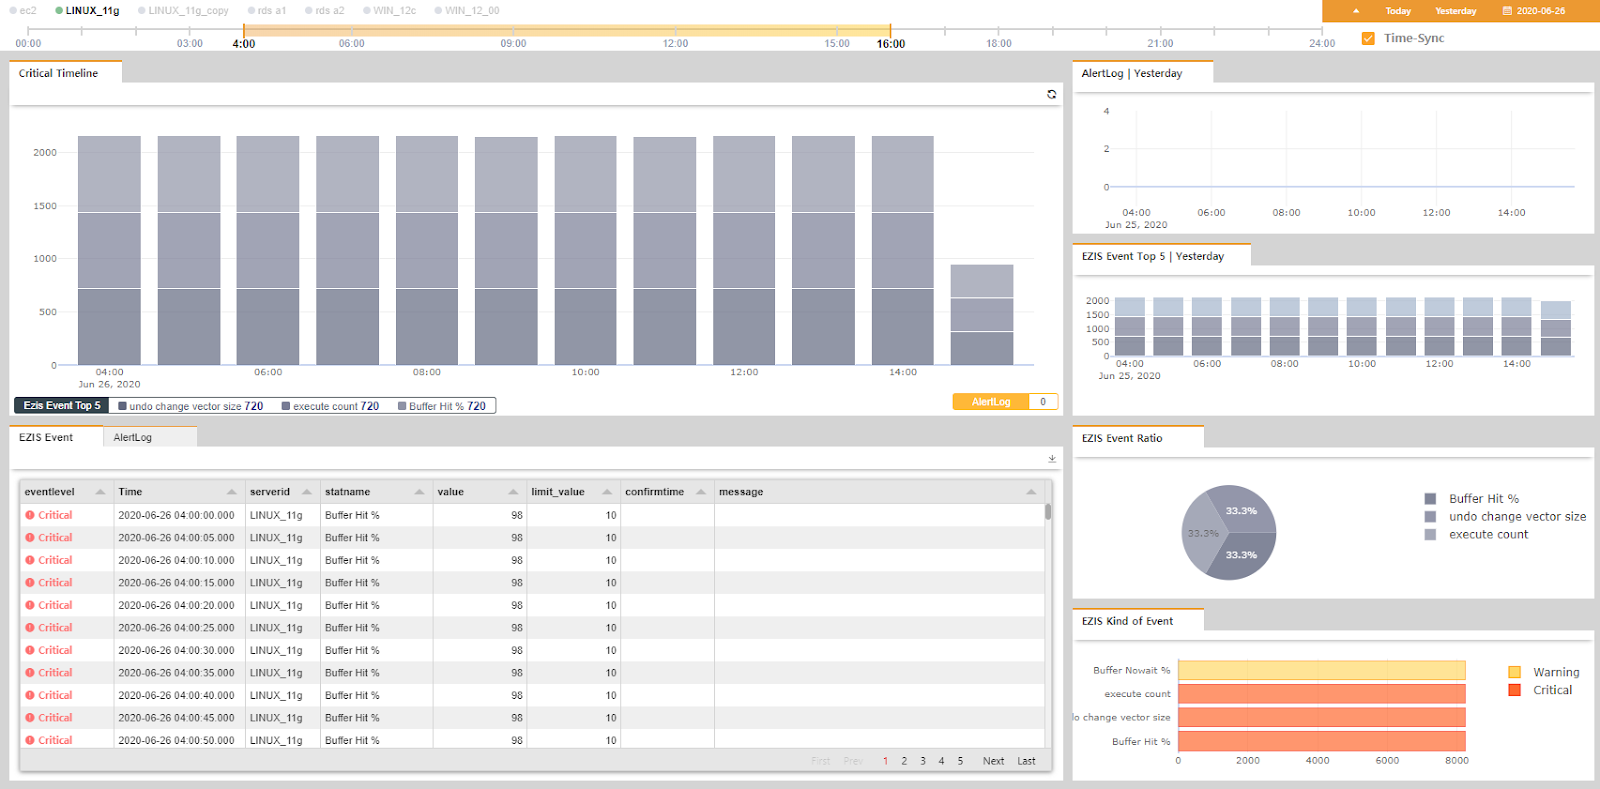
Critical Timeline Chart
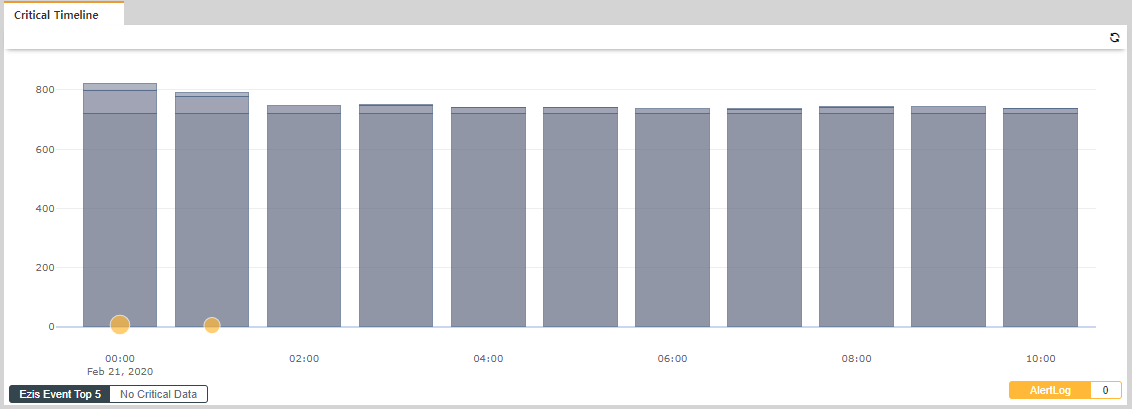
If the threshold is exceeded by specifying a threshold in the indicator, visualize the top five frequency of occurrence based on the Critical criteria and display them in the Timeline section. Users can easily understand and find alarms that have occurred by time zone.
- When Oracle alertlog occurs, they are plotted on the graph. The size of the point is proportional to the number of occurrences.
- Hover your mouse over the graph to display the alarm indicators and values in Top 5 form at the bottom of the graph. When you click a graph, the time zone of the lower Event, AlertLog grid, Event Ratio, and Kind of Event graph area is updated at the time you select it.
- Alertlog appears on the screen in from of dots and display the number of alertlogs at the bottom of the screen as alarms that exceed the general threshold.
AlertLog Yesterday, Event Alarm Yesterday chart
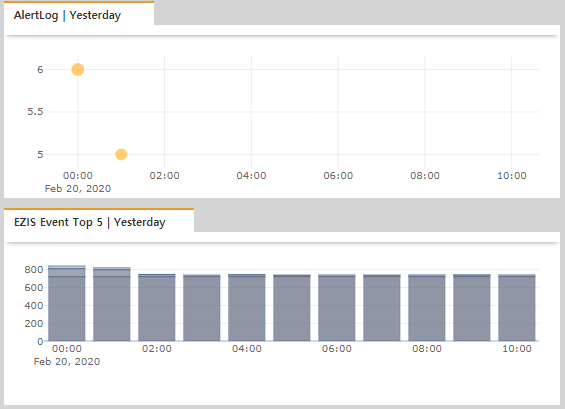
- The alarms that occurred on the day before the inquiry base date are displayed graphically as time intervals.
- It has the advantage of being able to find the time of day faster than when inquiring the raised alarm while changing the date.
- The alertlog that occurred the day before the lookup base date is graphically displayed as the time interval.
- It has the advantage of being able to find out when an alertlog occurred faster than when inquiring the alertlog by changing the date.
Event Ratio chart
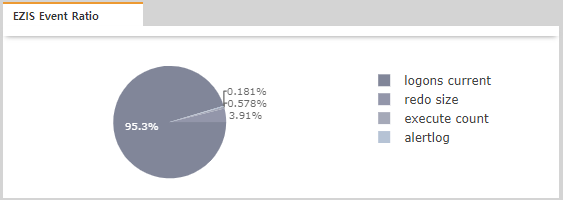
- Select bar on top 5 to visualize and show the alarm as a percentage.
Kind of Event
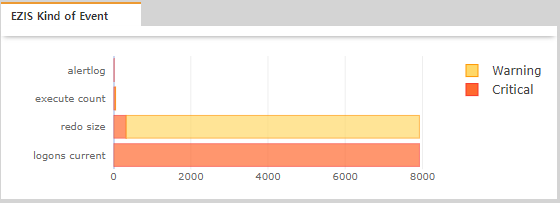
- Select bar on Top 5 to visualize and show the alarm as a percentage.
Event List
- The alarm for the time zone of the lookup interval is displayed.
- EventLevel : History of events when the configured thresholds for Critical and Warnring are exceeded.
- Time : The time the alarm occurred.
- Server ID : Indicates the monitored server on which the alarm occurred.
- Stat Name : The indicator name.
- Value : The value of the indicator that has occurred above the threshold.
- Limit Value : Threshold value set by user, caused by exceeding this value
- Confirm time : This is the time recognized by the alarm.
Alertlog List
- Oracle alertlog history can be viewed by time zone.
- Alerlogtime : The time when the Oracle alertlog occurred.
- Server ID : This is a representation of the monitored server on which the alarm occurred.
- Inst ID : This is the inst id of Alertlog.
- Text :The contents of the alertlog.
- Caution: If the monitoring server is configured with On-premise, you may not be able to display it due to timeouts in order to collect physical alertlog files because the size of the files will increase unless you manage them separately.